Monthly View - December 2024
Red sweep boost US sharemarket
A decisive election win by President Trump and the Republican party boosted US sharemarkets in November. The US Dow Jones finished up 7.5% in November, while the S&P 500 was up 5.7%. For both indices it was the best month since last November. The tech-heavy Nasdaq Composite finished the month up 6.2%. Both the S&P 500 and Dow Jones indices finished November in record territory, notching their 53rd and 47th record closes for the year respectively. Meanwhile, the US dollar traded at a two-year high.
President Trump won all seven of the closely fought battleground states and the Republican Party also won slim majorities in the Senate and House of Representatives. This provides an easier path for Trump to enact his policy agenda.
So far markets have focused on Trump’s business friendly policies of lower taxes and deregulation. Trump also campaigned on imposing tariffs and implementing strict immigration measures. His policy mix is expected to place upward pressure on inflation and lead to larger government deficits.
Global Equities
Global sharemarkets[1] rose 4.1% in November, led higher by the US sharemarkets. Global sharemarkets have gained 10.7% and 27.1% over the last six and twelve months respectively.
Along with the US election outcomes, the US sharemarket has also been supported by solid corporate earnings results, the reduction in short-term interest rates by the US Federal Reserve (Fed), and better than expected economic data.
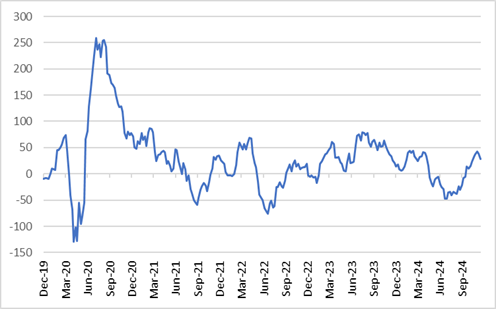
As highlighted in the graph below, more recent economic data has surprised to the upside, as measured by the Citi US Economic Surprise Index (An index reading over zero, indicates economic performance is generally beating market expectations).
Citi US Economic Surprise Index

Source: Bloomberg, JMI Wealth
Retail sales, services sector activity, and consumer confidence have been amongst US economic data to surprise to the upside recently.
The US third-quarter earnings season finished in November with 75% of companies reporting earnings better than expected. Year-over-year earnings growth was 5.8%, which is the 5th straight quarter of year-over-year earnings growth. Year-over-year earnings growth is projected to grow to 12% in the fourth quarter.
Companies issuing earnings updates in November included the very much anticipated result from Nvidia, who beat earnings estimates as demand for its powerful AI chips remains robust. Nvidia’s quarterly net income more than doubled from a year ago to US$19.3 billion, this was on quarterly sales of $35.1 billion. Retailer Walmart and DIY chain Lowes also beat market earnings expectations. Both companies highlighted that potential tariffs could force them to raise prices and that higher tariffs would be inflationary.
The European and emerging markets underperformed in November, primarily on concerns over the negative impact on economic growth from potential US tariffs. The European market index fell 0.4% and emerging markets 2.7% over the month.
Australasian Equities
New Zealand’s sharemarket[2] gained 3.4% in November given the positive global backdrop and despite subdued earnings updates from several local companies, Turners (+19%) and Stanford (+13.4) were amongst the better performing companies over the month.
Amongst those companies delivering positive updates was Fisher and Paykel, who announced a record half year result. Gentrack rose 40.5% over the month after indicating earnings growth will be robust in the years ahead. Reflecting the fragile state of the local economy, earnings updates from retail companies were mixed. The Warehouse Group remains cautious ahead of the important summer trading period. KMD Brands, owner of Kathmandu, noted trading had improved on prior experience, however, they are doing significantly better in Australian than in New Zealand. Ryman Healthcare disappointed the market with their earnings update and ended the month down 6.4%.
Australian equities rose 3.8%[3] in November buoyed by global developments and reached historical highs during the month. As has been the case for some time, Australian banks outperformed in November, led higher by a 11.8% gain in CBA. The Australian banking sector has outperformed the broader market (ASX 200) by 30% since the beginning of the year. Commodity companies underperformed on soft global commodity prices following weak European economic data. BHP fell -4.9% in November.
Fixed income and cash markets
The Bloomberg Global Aggregate Bond Index (New Zealand dollar hedged) returned 1.2% in November. Global longer-term interest rates fell over the month, particularly across Europe (the German 10-year government bond yield fell 30 basis points to 2.09%). Softer than anticipated measures of activity in the services and manufacturing sectors, growing political uncertainty, and the prospect of US tariffs (considered negative for European economic growth), pushed European interest rates lower.
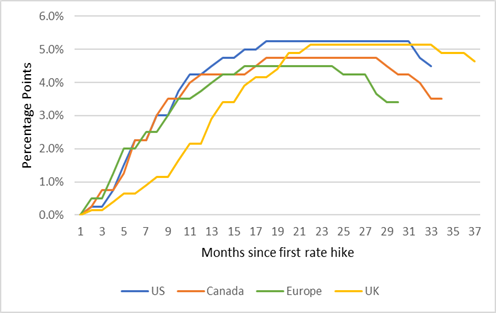
The Fed cut the Federal Funds rate by 25 basis points (0.25%) to a target range of 4.50% - 4.75% in November. The Fed has become more cautious in relation to the pace at which they will undertake further interest rate reductions given elements of inflation are proving stickier than anticipated. As highlighted in the graph below, the Fed is one of several central banks that have commenced interest rate cuts this year, including the Reserve Bank of New Zealand (RBNZ).
Change in central bank interest rates since 2021

Source: Bloomberg, JMI Wealth
The RBNZ cut the Official Cash Rate (OCR) by 50 basis points (0.5%) to 4.25%. The RBNZ has reduced the OCR from a peak rate of 5.5%, having commenced interest rate reductions in August 2024. The RBNZ’s Monetary Policy Statement outlined that inflation is sustainably within their 1.0% - 3.0% target range. The RBNZ signaled another 50 basis points cut was likely in February 2025, bringing its forward guidance for interest rate reductions largely in line with market pricing. The RBNZ forecast the OCR to be at 3.0% by the end of 2026.
Despite a pickup in consumer and business confidence, current domestic economic activity remains subdued. The RBNZ anticipates the local economy returning to growth in 2025 and for the unemployment rate to peak at 5.2% in the March quarter 2025.
The local fixed income market[4] rose 0.6% for the month and is up 8.0% over the last twelve months.
Conclusion
The pro-growth policy mix of a Trump presidency, including the prospect of low corporate taxes and deregulation, is supportive of US corporate earnings, particularly for smaller to mid-sized companies. A further reduction in short-term interest rates and continued US economic growth will be positive for global sharemarkets.
The RBNZ is anticipated to cut interest rates further in the months ahead. Lower short-term interest rates and the likelihood that domestic corporate earnings are at cyclical lows provide the opportunity for the local sharemarket to perform solidly in the year ahead. The global economic and market backdrop will also be supportive of the local market.
The relative attractiveness of domestic bonds has declined given the dramatic fall in longer-term interest rates. The anticipated decline in shorter term domestic interest rates in the months ahead is negative for people looking at term deposits to provide them with income.
Global bonds continue to offer stability of income and the potential for capital gains from further reductions in interest rates as inflation continues to decline and central banks progress interest rate cuts.
The current environment remains constructive for both fixed income and equity markets. This provides a favourable backdrop for a well-diversified balanced portfolio. In this environment, we recommend investors continue to focus on their long-term goals while acknowledging that in the short-term returns may be volatile. In time, this approach should reward investors.
1 MSCI ACWI Index in local currencies
2 S&P NZX 50 gross index
3 S&P ASX 200 total return Index
4 Bloomberg NZ Bond Composite 0+ Yr Index
Indices for Key Markets
| As at 30 November 2024 | 1 Month | 3 Months | 6 Months | 1 Year | 3 Years p.a. | 5 Years p.a. |
| S&P/NZX 50 Index | 3.4% | 5.2% | 10.6% | 16.2% | 1.7% | 3.7% |
| S&P/ASX 200 Index (AUD) | 3.8% | 5.5% | 11.5% | 23.4% | 9.6% | 8.3% |
| MSCI ACWI Index (Local Currency) | 4.1% | 4.9% | 10.7% | 27.1% | 9.0% | 12.1% |
| MSCI ACWI Index (NZD) | 4.4% | 9.3% | 14.5% | 31.1% | 12.8% | 13.2% |
| S&P/NZX 90 Day bank bill Total Return | 0.4% | 1.3% | 2.8% | 5.7% | 4.3% | 2.8% |
If you have any questions please contact us on +64 9 308 1450
Information and Disclaimer: This report is for information purposes only. It does not take into account your investment needs or personal circumstances and so is not intended to be viewed as investment or financial advice. Should you require financial advice you should always speak to your Financial Adviser. This report has been prepared from published information and other sources believed to be reliable, accurate and complete at the time of preparation. While every effort has been made to ensure accuracy neither JMI Wealth, nor any person involved in this publication, accept any liability for any errors or omission, nor accepts liability for loss or damage as a result of any reliance on the information presented.